We are Homo Sapiens - ‘thinking men’. It is ironic that our species, which is defined by our big brains, is evolving to become stupid. Countless articles of scientific research have found the less intelligent to be having more surviving offspring and breeding faster than the intelligent. The problem was noticed by Darwin and his contemporaries, yet it has mostly been ignored throughout the 20th century. Recently it has had a small yet significant revival with the cult classic book At our Wits’ End, and large genetic databases showing intelligence decline - it has even been featured in the Telegraph.
With the large role intelligence plays in every aspect of civilization, this problem of dysgenics is always on my mind. It’s not an exaggeration to say that I think about it every day. Yet, as I say, it’s hard to get people to take this concept of ‘anthropogenic cranial shrinkage’ seriously. Partly this is because of taboos around human biological diversity and the spectre of forced sterilisation implied by the very name of the solution - eugenics. But a major issue is that we really don’t know the magnitude of the problem.
The famous studies of dysgenics in the UK biobank show there is selection against intelligence but don’t attempt to quantify its size. The famous Icelandic study shows dysgenics but only attempts to measure its effect on years in education, not intelligence itself.
Many of the older studies, such as those looking at peoples’ fertility by IQ, have an array of methodological issues such as not accounting for the different speeds at which people have children. It is not helped by the fact that so much of this older literature has focused on the correlation coefficient between IQ and fertility, which alone is not sufficient to identify the magnitude of dysgenics. And even if there were some good measurements, to get a real grasp of the issue we need to know the speed of dysgenics across many countries, not just in the UK or Iceland.
So after a long period of studying the literature, I decided to resolve this problem and write a blog post giving you the numbers clearly. This is not that blog post. The issue has proven too complex for me to pin down. Yet through this process, using some extremely strong assumptions, I’ve made some commentary and graphs about dysgenics and I hope you enjoy them.
There are three parts to estimating future global IQ. The first is estimating the future population of each country and its current IQ. The second part is estimating the rate of dysgenics within countries. The third part is estimating the Flynn Effect within countries, but that appears to be stopping and it is not clear that Flynn Effects are anything more than a sort of ‘IQ inflation’ where our measurements increase but intelligence does not. This is owing to Goodhart’s Law - “When a measure becomes a target, it ceases to be a good measure.” So then we add these parts together, but I’m going to ignore the Flynn Effect.
Another note on ignoring the Flynn Effect - national IQ so far correlates 0.9 with genetic estimates of intelligence (polygenic scores), making it perfectly reasonable to think of national IQs as a very strong proxy for ‘real’ genetic differences in intelligence. Yes, there are confounding problems in comparing polygenic scores across racial groups, but r = 0.9 cannot be easily explained by alternative hypotheses.
Nonetheless, there is still a problem of comparing or aggregating national IQs and individual IQs since they differ in their respective compositions of genetic and environmental components. Environmental ‘Flynn’ differences are much bigger between nations than within them and yet this component seems to have fewer real effects.
Between-Country Dysgenics
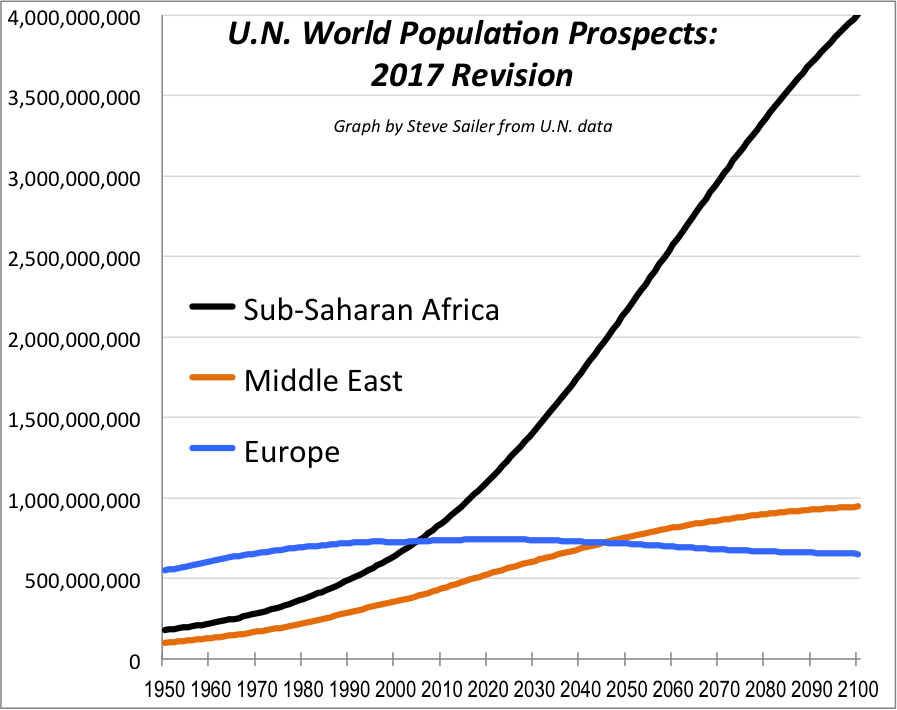
Let’s start at level one - between country dysgenics. The Industrial Revolution kicked off the fertility transition. Countries that became rich were able to prevent starvation and improve health so the number of surviving children skyrocketed. Then with the advent of contraception, abortion and enjoyable alternatives to raising children, fertility plummeted. Many of the poorer, less intelligent countries started this process later meaning that as the natives of smart countries shrink in their population, the low IQ countries are still rapidly expanding
.
The above moving wave in fertility implies that the centre of population mass is going to move to the developing world, substantially reducing per capita welfare. Whilst Africa had a population of 140 million in 1900, UN estimates predict the whole of Sub-Saharan Africa will have a population of 4 billion in 2100. We’ll use the current UN population forecast under the no-migration scenario in our model.
Within-Country Dysgenics
My favourite estimate of the rate of dysgenics comes from Woodley’s calculation in At Our Wits’ End. He takes the Icelandic estimate for the rate of dysgenics on the educational attainment (years in education) polygenic score, adjusts it for the higher heritability of intelligence (about 80% heritable) and estimates a 0.8 IQ point decline per decade. That’s a lot. My guess is that this is an overestimate. Education attainment correlates negatively with fertility because it captures both the effect of intelligence and the effect of education, creating an overestimate. On the other hand, years in education is less heritable than IQ, causing the unaltered Icelandic estimate of about 0.3 IQ points to be an underestimate.
This is tricky, so let’s be cautious, split the difference and round up. IQ is falling by 0.6 points a decade.
But isn’t the rate of dysgenics different between countries? They can’t all be declining at the same speed. Gerhard Meisenberg found that the correlation between education and fertility is less negative in the more intelligent countries in the World Values Survey. But education might be differently related to IQ in different countries. And once again, the correlation coefficient can identify the direction of dysgenics, but not the magnitude. I tried using the World Values Survey data myself to estimate the rate of dysgenics but did not find any association with national IQ. So maybe dysgenics really doesn’t differ much between countries? The intuition for why our results differ is as follows. Low IQ countries have a more negative IQ fertility correlation, suggesting that intelligence has a stronger effect on the number of children. But low IQ countries also have a higher average fertility rate which dilutes the effect of their least intelligent having more children. The two effects seem to balance each other out.
So the World Value Survey does not provide any evidence to think that dysgenics differs between countries, so let’s just assume a homogenous rate across all countries.
Putting it all together
We have UN estimates of predicted population by country till 2100 (assuming 0 migration) and we have assumed a 0.6 within-country IQ point decline per decade. We take our starting national IQs from David Becker’s IQ dataset normed at 1991 and apply dysgenics forwards and backwards.
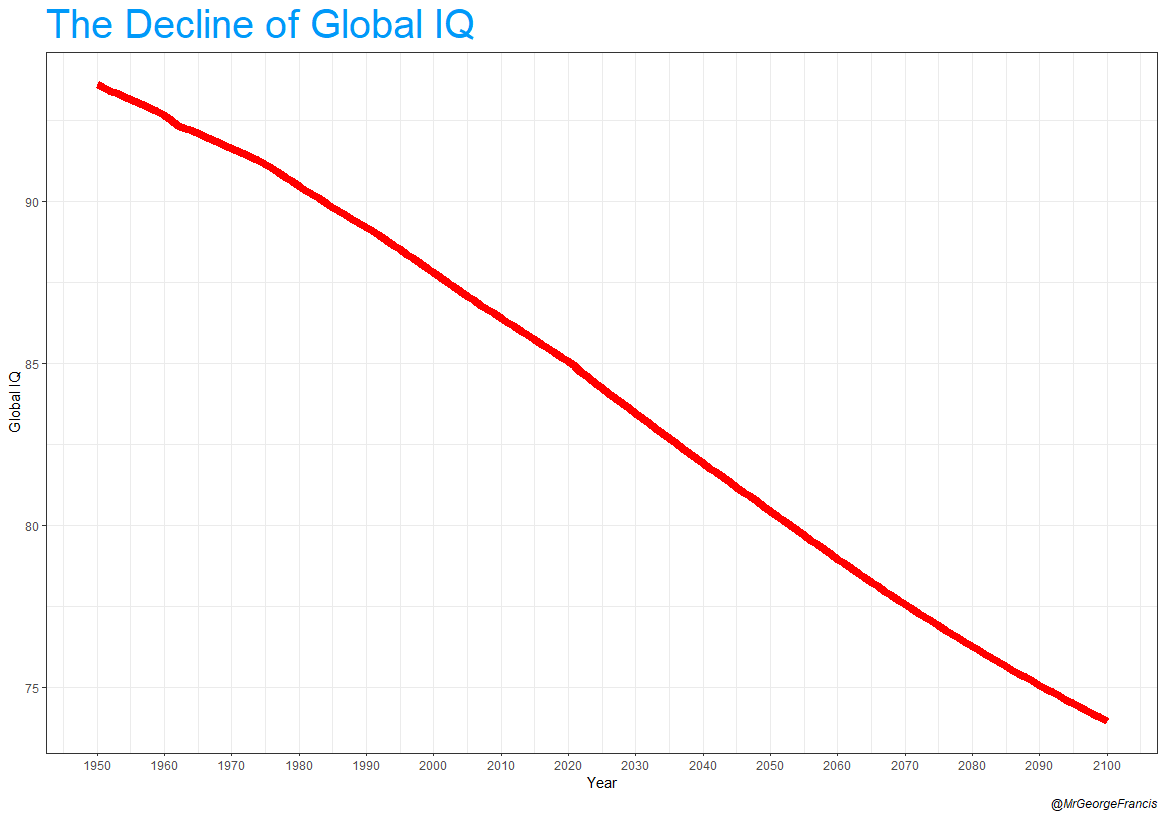
In 1950 the average genotypic IQ was around 93.6. If you are not a high school graduate you need an IQ of 93 to join the US military. In 1950 something like half of the world’s population was too dumb to be in a professional army. Currently, the global average IQ is around 85 and by the end of the century, it will be 74. Then only an elite fraction would be capable of even being part of a professional army.
Average global IQ of 74 - dysgenics is a big problem! Let’s try and narrow it down a bit more. In Francis and Kirkegaard (forthcoming) we estimate that each national IQ point is associated with a 7.8% increase in GDP per capita. We also estimate the economic effects of dysgenics in that paper slightly differently, but with similar results. Let’s imagine the world is one country with an average IQ of 74 in 2100 and an average IQ of 85 as of 2020. The maths works out as a difference of logs at [exp((74-85)*7.8%) -1] = -58%. The effect of this dysgenic decline will be to cut GDP in half! And of course, that doesn’t even begin to consider the intangible factors GDP doesn’t necessarily include - low crime, social trust, science, culture and the arts.
Climate change is currently predicted to cost us a whopping 4% of world GDP by 2050. My numbers imply dysgenics will cost us 30% of GDP by 2050. We should be willing to spend huge amounts of money to solve this problem. Dysgenics is truly an ‘unknown unknown’ that we are too afraid to even talk about.
Declining intelligence is a big problem, which will cost us half of the economy annually. So hey, effective altruists, spread the word and let’s start solving this problem! If you want to help you can start by subscribing…


Another thing to consider--though technically not dysngenics in the traditional sense, is the effect of an ageging population on intelligence.
'Fluid intelligence', that is to say, the intelligence behind problem solving, creativity & innovation peaks rather than crystallized intelligence(i.e. knowledge) at ~20 years of age, and reduces up to a standard deviation by middle age(~50).
We have a large ageing crisis that will peak also during dysgenic evolution. From an average of 35 in 1950 to 45 in 2050. In countries like South Korea it's up to 57.
Say the 'high estimate' of 0.8 IQ drop per decade occurs in Korea, that's a 2.4 point drop by 2050. At the same time, we can expect half a standard deviation to drop due to ageing--that's about a 8 point drop by 2050--even more drastic (this is counterbalanced by 'crystallized' intelligence somewhat but still).
Expect countries like South Korea: one of the most intelligent: 102 IQ to drop to ~92.
Seems like it should be self-limiting. Global IQ crashing to sub-saharan levels renders the maintenance of high tech civilization, including high-productivity agriculture, impossible. It follows that a die-back should cull the herd. Famine and war reestablishing malthusian conditions will reduce the population to whatever level is compatible with the intelligence of that population, while re-introducing selective pressure for intelligence. Then the cycle will continue.